Recent CMHC data released on
condominium apartment completions in the Toronto CMA is turning heads, reporting
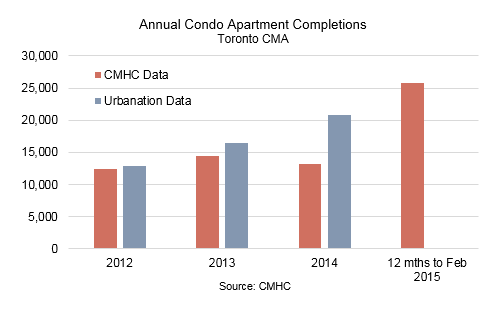
that close to 14,000 units were finished in the first two months of the year — with
10,000 in January alone.

According to the CMHC data,
completions so far in 2015 have already exceeded the total for all of 2014. In
fact, the data would indicate that within a few months, completions will have already
broken the annual record of 17,878 units set in 2011.
But is this really what’s going
on? It depends on your definition of a ‘completion’.
CMHC records completions as
occurring after more than 90% of a building is completed, including all of the
final finishes for all the units, common areas and outdoor grounds. Urbanation records
completions once occupancy begins. As completions represent a key supply
indicator in the GTA condo market, Urbanation feels it’s crucial to tally the
data as soon as units can be considered built inventory. Contemporaneous reporting of completions alongside resale and rental listings allows for better analysis of supply pressures -- an ever-present question in local condo market.
Two good examples are the Aura and L-Tower projects, both of which weren't 90% finished as of February, but occupancy was well underway and units had already been put on the market.
The completions happened last year
As the chart below shows, there
has been a growing divergence between the CMHC and Urbanation totals over the
past couple years. Given the difference in timing, this is to be expected in
absolute terms as completions have trended higher. However, a substantial
difference was recorded for 2014. While the Urbanation data showed a record
number of completions (20,809 units), the CMHC completion totals fell back last
year to 13,258 units. The 7,500-plus
unit gap suggested a large backlog of projects waiting for final touches had
accumulated. And this gap didn’t suddenly emerge at the end of the year — it
was present throughout most of 2014.
While Urbanation has yet to
compile Q1 completions numbers, our preliminary assessment points to a total
nowhere near CMHC’s figures for January and February, supporting the notion
these ‘completions’ occurred last year. Effectively, these latest data points from CMHC are ‘old news’.
In this context, looking at the data over the
past 12 months is more appropriate. The CMHC data, at 25,791 units to February
2015, shows compensation for the shortfall against the Urbanation data in
2014.
In the end, why is it so
important to closely monitor completions as they occur? For a
couple key reasons.
Jobs
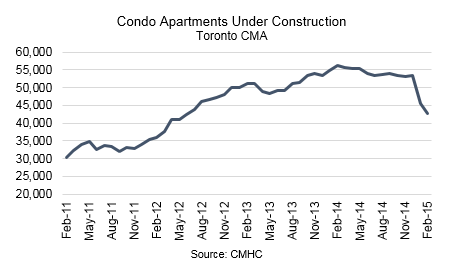
First, rising completions can
mean a reduced inventory of projects under construction if starts can’t keep an equivalent pace (which has been the case over the past year). According to the Building
Industry and Land Development Association, each construction crane represents the creation of about 500 jobs. Assuming an average project size of roughly 250 units, the 13,200 fewer
units under construction in February compared to a year ago equates to 27,000 lost jobs. If accurate, that's about 1% of the Toronto CMA employment base, raising concerns that at least some temporary
impact on demand would materialize until construction starts picked up (which we expect they will
given the large number of units in pre-construction qualifying for financing).
A Measure of Supply
Second, calculating the number of completed units over a
period time helps provide a measure of the total inflow of new supply against
new demand. Household formation rates have averaged roughly 35,000 households
per year over the 2001 to 2011 period. So if condo completions are running at 25,000
units and other forms of housing completions are reported at 17,000 units over the past 12 months, it may potentially indicate some oversupply developing.
While there is no way of precisely calculating total housing demand outside of the Census data reported every five years, we can test the current degree of oversupply in the market by looking to a few key variables: the level of completed and unabsorbed units, the ratio of
resale transactions to listings, vacancy rates and rent growth.
Standing Inventory
According to the CMHC data, the number of completed and
unsold condo apartments jumped to 1,758 units in February, nearly double its
level from a year ago and the highest level since the early 1990s when the
condo market, along with the rest of the housing market, last crashed.

This number is important to monitor, but it also needs
context. Of particular note, is that the percentage of units absorbed at completion
was 92% in January and 96% in February (in line with the 10-year average of
94%) — meaning each project, on average, that comes to completion still has
just a handful of unsold units, which limits disruptions to the market. And the
units may not even be offered for sale — the developer could be content with
holding onto them for sale at a later date and renting them out (if a unit is
rented, it is not necessarily counted as being absorbed).
Also, the current level of inventory doesn’t mean what it
used to. Over the past 10 years, the resale market has doubled in size — so now the 1,800 units represent about a half percentage point of total built units and about 12% of the total resale and rental listings on the MLS during the fourth quarter.
And demand for condos is also on the rise. Resale transactions reached a record
high in 2014 and the market is tightening.
Sales-to-Listings
In the fourth quarter of 2014, the ratio of
sales-to-listings reached 50%, the threshold between a balanced and seller’s
market. This led prices to grow at a 4% annual rate at the end of the year, which should continue to climb in early 2015 due to current conditions. Resale listings growth has been very limited, particularly in light of the high volume of completions. Urbanation calculated that less than 3% of units completed and registered in 2014 turned over in the resale market, versus 24% of which that were rented out on MLS.

Vacancy Rates and Rent Growth
Similar to the resale market, Urbanation collects data on the ratio of condos leased and listed for rent. However, there hasn't been enough variability in the data and a long enough time series to draw conclusions on its power for assessing market conditions.
CMHC reports vacancy rates for condo rentals once a year, capturing snapshots of the condo rental market each fall. The latest data for 2014 showed that vacancy rates declined from the year prior to 1.3%, despite huge increases in new rental supply over the previous two years to the tune of 27,000 units, equal to 42% growth in the universe.

While certainly an encouraging statistic, the data may not be telling the whole story. The survey only covers units officially registered as of June of each year, meaning most of the record completions last year were missed.
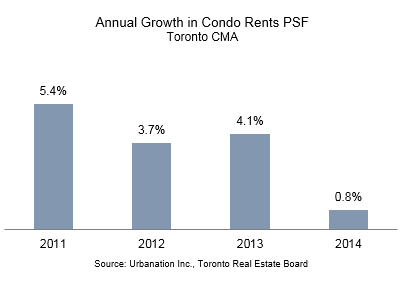
Perhaps a more accurate reading of current condo rental market conditions can be found in measurements of rent growth per sq. ft. Urbanation's calculations show that annual rental appreciation slowed to 0.8% in 2014 from an annual of average of 4.4% in 2011 to 2013. This is believed to be the first indication that the condo rental market is exhibiting more balanced conditions than suggested by the lagged CMHC data.
Summary
Look back to 2014 data for answers on how the recent surge in CMHC condo completions has affected the GTA condo market, because that's when they actually occurred. The clearest signal has emerged from within the rental market by way of reduced rent growth — but this just one indication of some modest supply pressure in an otherwise strong overall market.
It is critical to keep a close eye on completions and market conditions for condos in 2015. According to Urbanation's database of projects in development, over 27,000 units are scheduled for occupancy this year. Knowing when and how exactly how this unfolds will provide accurate market readings and allow for a better understanding of current conditions and help formulate expectations about the future.